Smith v Kohli
ODIs 2017
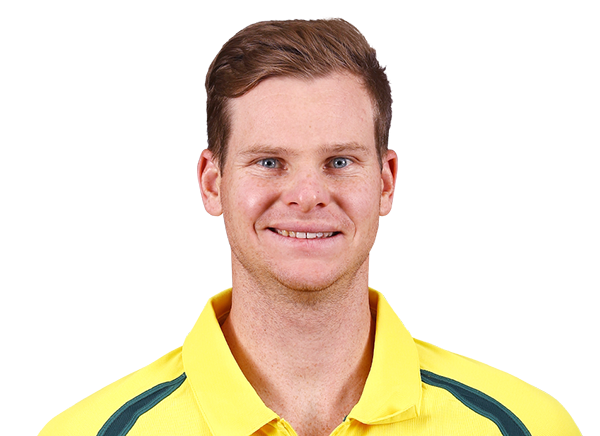
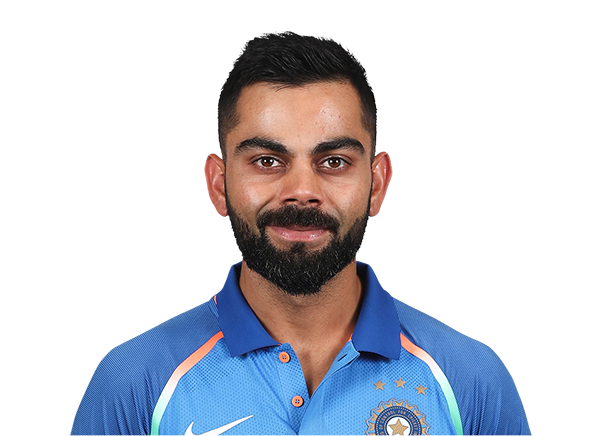
Lineball analyst0–8
Virat Kohli takes it, 8–0 on categories
Kohli wins on runs — the run machine of the two. ODIs 2017: Smith 13 matches (13 innings), Kohli 29 matches (29 innings).
- Kohli averages 96.5 with the bat (1,833 runs in 29 innings) to Smith’s 30 (330 runs in 13 innings).
- Kohli has the better strike rate: 98.5 to Smith’s 75.3.
- Kohli averages 5.9 fours an innings to Smith’s 2 — 3 times as many.
- Kohli ranks 1st of 139 in ODIs 2017 for batting average.
- Kohli ranks 2nd of 140 in ODIs 2017 for runs per innings.
- Highest score: Kohli 160, Smith 63.
- Winners’ edge: Kohli’s team won 76%, Smith’s team won 15% of the matches they played.
- Longevity: Kohli has 29 matches (29 innings), Smith 13 — the averages matter more than the totals here.
Built only from games in our stats database. A read of the numbers, not a tip.
Tale of the tape
Per game, with league rank among regular players.
- 25.4330 total · best 63#58 of 140Runsper game63.21,833 total · best 160★ #2 of 140
- 30.0#66 of 139Batting average96.5★ #1 of 139
- 75.3#95 of 130Strike rate98.5#23 of 130
- –Hundredsper game0.38 total · best 1★ #2 of 47
- 0.45 total · best 1#59 of 134Catchesper game0.514 total · best 2#40 of 134
- 226 total · best 8
Last 10 games
Runs, oldest to newest in 2017.
Smith15963316231845412
Kohli3912129113112461607536129