Nelson v Wallam
Super Netball 2026
 Shimona NelsonMelbourne Mavericks15 games · 2026
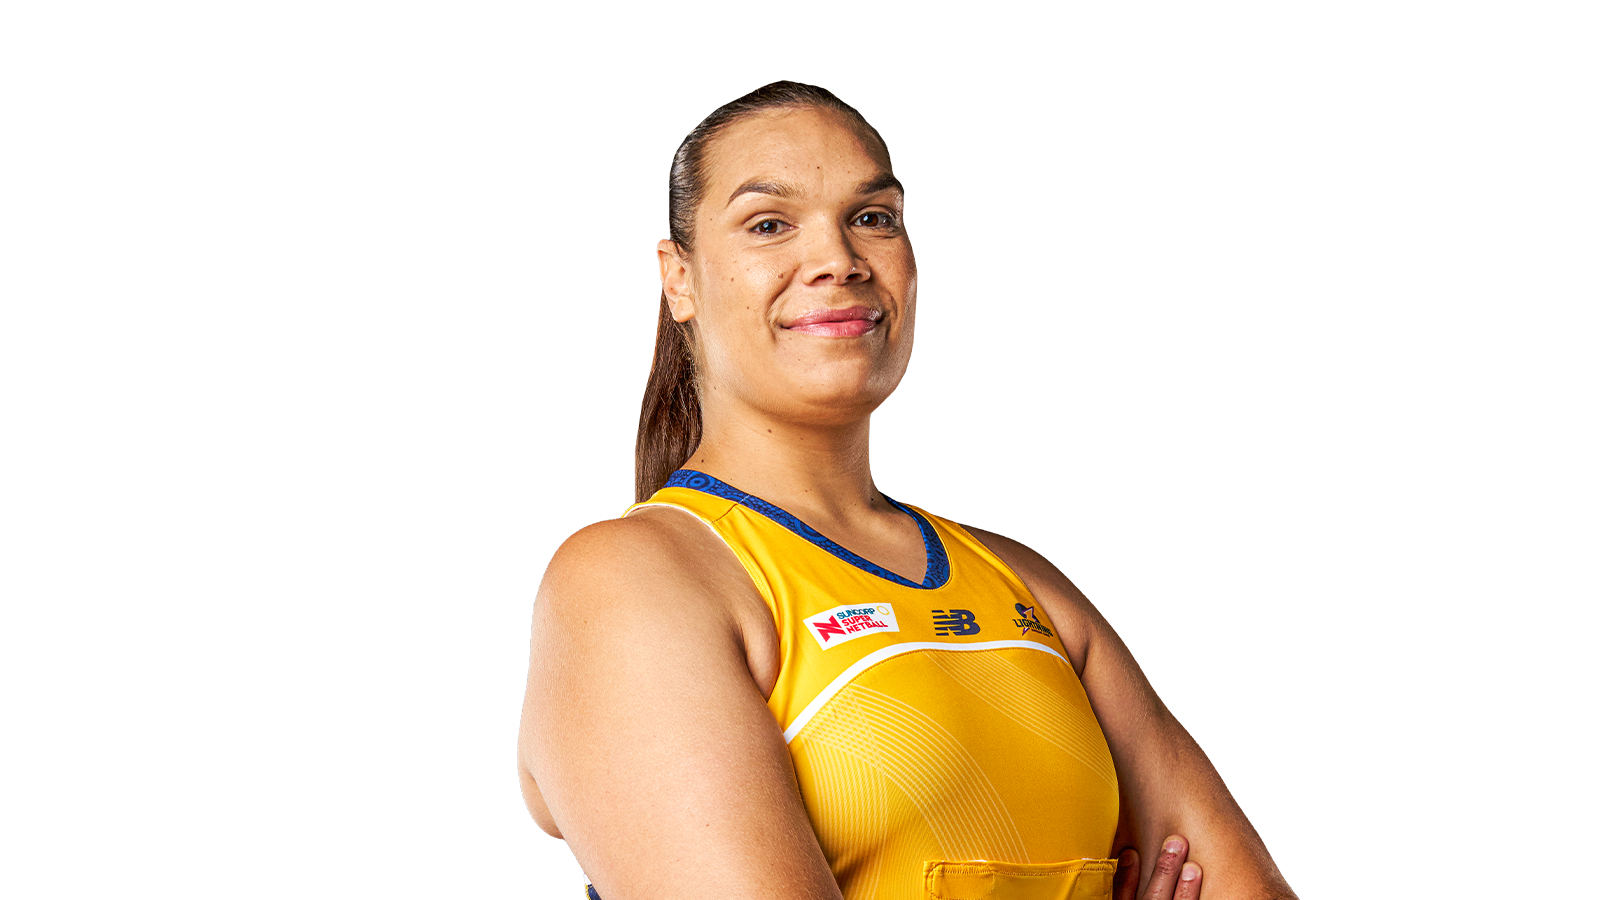 Donnell WallamSunshine Coast Lightning14 games · 2026
Lineball analyst2–12
Donnell Wallam takes it, 12–2 on categories
Wallam wins on goal assists — the feeder of the two. Nelson’s case rests on shooting %, but it isn’t enough to swing it. Super Netball 2026: Nelson 15 games, Wallam 14 games.
- Wallam averages 1.7 goal assists a game to Nelson’s 0.7 — 2.3 times as many.
- Wallam averages 3.4 feeds a game to Nelson’s 1.1 — 3.2 times as many.
- Wallam averages 44.1 goals a game to Nelson’s 38.5 (15% more).
- Head to head: they’ve faced each other 2 times — Nelson’s side won 2, Wallam’s 0. In those games: 56 goals a game to 31.5.
- Nelson ranks 1st of 26 in Super Netball 2026 for shooting %.
- Nelson ranks 5th of 27 in Super Netball 2026 for goals per game.
- Best single game: Nelson 57 goals, Wallam 54.
- Winners’ edge: Nelson’s team won 60%, Wallam’s team won 36% of the games they played.
Built only from games in our stats database. A read of the numbers, not a tip.
Tale of the tape
Per game, with league rank among regular players.
- 38.5577 total · best 57#5 of 27Goalsper game44.1618 total · best 54★ #3 of 27
- 92.3★ #1 of 26Shooting %82.7#10 of 26
- 0.711 total · best 2#49 of 63Goal assistsper game1.724 total · best 5#45 of 63
- 1.116 total · best 2#52 of 66Feedsper game3.448 total · best 6#45 of 66
- 00 total · best 0Gainsper game0.23 total · best 1#63 of 73
Last 10 games
Goals, oldest to newest in 2026.
Nelson20455738235627403333
Wallam32525044515431
When they met
- 23 May 2026Melbourne Mavericks 63Nelson 56 GSunshine Coast Lightning 53Wallam 31 G
- 12 Apr 2026Melbourne Mavericks 62Nelson 56 GSunshine Coast Lightning 53Wallam 32 G