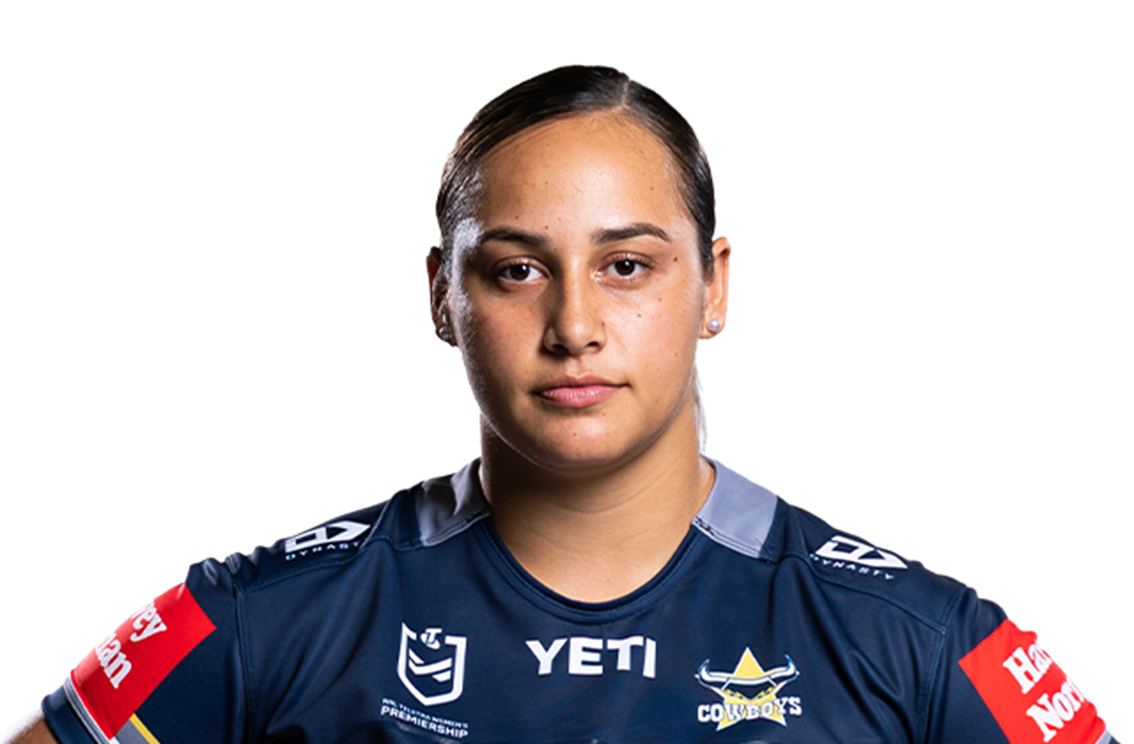
North Queensland Cowboys Women
Tiana Raftstrand-Smith
Key facts
- Age
- 23
- Height
- 174 cm
- Weight
- 104 kg
- Born
- 17 June 2003
- Birthplace
- Auckland, NZ
- Debut
- 27 February 2022 v St. George Illawarra Dragons Women (Rd 1)
- Position
- Interchange
- Debut club
- Gold Coast Titans Women
- Previous club
- Gold Coast Titans Women
- Junior club
- Burleigh Bears RLFC
- Nickname
- T
Official profile
Career stats
Every stat, every game this season
Swipe for more
| Opponent | Score | Tries | Goals | 1 Point Field Goals | 2 Point Field Goals | Points | Try Assists | Linebreaks | Tackle Breaks | Post Contact Metres | Offloads | Receipts | Tackles Made | Missed Tackles | Total Running Metres | Hit Up Running Metres | Kick Return Metres | Position | Minutes Played | |
|---|---|---|---|---|---|---|---|---|---|---|---|---|---|---|---|---|---|---|---|---|
| Rd 5 | Raiders | 16 - 18 | - | - | - | - | - | - | - | - | 8 | - | 4 | 5 | 1 | 19 | 19 | - | Interchange | 12 |
| Rd 6 | Bulldogs | 28 - 26 | 2 | - | - | - | 8 | - | 1 | 4 | 10 | 2 | 9 | 5 | 1 | 50 | 43 | 2 | Interchange | 19 |
| Rd 7 | Sharks | 30 - 18 | - | - | - | - | - | - | - | - | 16 | - | 6 | 2 | 2 | 42 | 19 | 16 | Interchange | 24 |
| Rd 8 | Dragons | 28 - 32 | - | - | - | - | - | - | - | - | 3 | - | 3 | 10 | - | 15 | 8 | - | Interchange | 11 |
| Rd 9 | Knights | 6 - 40 | - | - | - | - | - | - | - | - | 14 | 1 | 5 | 11 | 1 | 40 | 40 | - | Interchange | 21 |
| Rd 10 | Roosters | 6 - 56 | - | - | - | - | - | - | - | - | - | - | 1 | 9 | - | - | - | - | Interchange | 13 |
| Rd 11 | Eels | 33 - 28 | - | - | - | - | - | - | - | 1 | 28 | 2 | 11 | 11 | - | 85 | 58 | 26 | Interchange | 22 |
Career by season
Swipe for more
| P | W | L | T | G | Pts | Tkl | Run m | Fantasy avg | |
|---|---|---|---|---|---|---|---|---|---|
| 2021 | 6 | 3 | 3 | 1 | 1 | 6 | 68 | 470 | 25.7 |
| 2022 | 5 | 1 | 4 | - | - | - | 68 | 302 | 23.8 |
| 2023 | 8 | 1 | 7 | 2 | - | 8 | 100 | 577 | 28.6 |
| 2024 | 8 | 4 | 4 | 4 | - | 16 | 120 | 449 | 34.4 |
| 2025 | 4 | 1 | 3 | - | - | - | 30 | 120 | 14.0 |
| 2026 | 7 | 3 | 4 | 2 | - | 8 | 53 | 253 | 15.7 |
Every stat, by season
Swipe for more
| Played | Won | Lost | Drawn | Win % | Tries | Goals | 1 Point Field Goals | 2 Point Field Goals | Points | Kicking Metres | Kicking Metres Average | Goal Conversion Rate | Tackle Breaks | Post Contact Metres | Offloads | Tackles Made | Missed Tackles | Tackle Efficiency | Total Running Metres | Average Running Metres | Kick Return Metres | Total Points | Average Points | |
|---|---|---|---|---|---|---|---|---|---|---|---|---|---|---|---|---|---|---|---|---|---|---|---|---|
| 2021 | 6 | 3 | 3 | - | 50% | 1 | 1 | - | - | 6 | 44 | 7.33 | 100.00% | 13 | 200 | 9 | 68 | 18 | 79.07% | 470 | 78.00 | 36 | 154 | 25.7 |
| 2022 | 5 | 1 | 4 | - | 20% | - | - | - | - | - | - | - | - | 5 | 126 | 9 | 68 | 11 | 86.08% | 302 | 60.00 | - | 119 | 23.8 |
| 2023 | 8 | 1 | 7 | - | 12% | 2 | - | - | - | 8 | 16 | 2.00 | - | 16 | 216 | 13 | 100 | 16 | 86.21% | 577 | 72.00 | - | 229 | 28.6 |
| 2024 | 8 | 4 | 4 | - | 50% | 4 | - | - | - | 16 | - | - | - | 22 | 165 | 8 | 120 |
Recent games
- Round11v EelsInterchange · 22 min · 85 run m · 11 tackles33 - 28
- Round10v RoostersInterchange · 13 min · 9 tackles6 - 56
- Round9v KnightsInterchange · 21 min · 40 run m · 11 tackles6 - 40
- Round8v DragonsInterchange · 11 min · 15 run m · 10 tackles28 - 32
- Round7v SharksInterchange · 24 min · 42 run m · 2 tackles30 - 18
- Round6v BulldogsInterchange · 19 min · 2 tries · 50 run m · 5 tackles · 1 LB28 - 26
- Round5v RaidersInterchange · 12 min · 19 run m · 5 tackles16 - 18
Stats from official league and public sports feeds. Updated hourly.