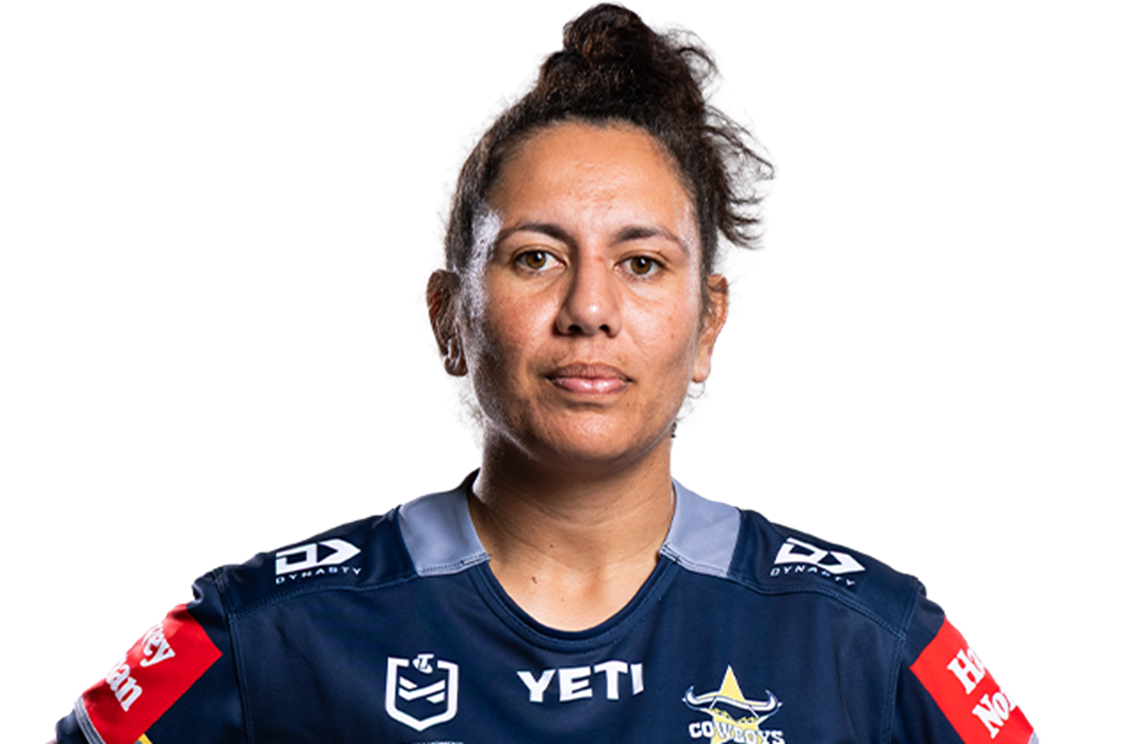
North Queensland Cowboys Women
Tallisha Harden
Bio
Born in Logan, QLD in 1992, Tallisha Harden made her senior debut with 2023 North Queensland Cowboys Women season in 2018 and has also played for Brisbane Broncos Women and Sydney Roosters (women's rugby league). She plays at 2nd row.
Key facts
- Age
- 34
- Height
- 176 cm
- Weight
- 77 kg
- Born
- 21 July 1992
- Birthplace
- Logan, QLD
- Debut
- 21 September 2018 v New Zealand Warriors Women (Rd 3)
- Position
- 2nd Row
- Debut club
- Brisbane Broncos Women
- Junior club
- Sunnybank Dragons Rugby Union Club
- Nickname
- Tee
Official profile
Career
- 2023 North Queensland Cowboys Women season
- Brisbane Broncos Women
- Sydney Roosters (women's rugby league)
Career stats
Every stat, every game this season
Swipe for more
| Opponent | Score | Tries | Goals | 1 Point Field Goals | 2 Point Field Goals | Points | Try Assists | Linebreaks | Tackle Breaks | Post Contact Metres | Offloads | Receipts | Tackles Made | Missed Tackles | Total Running Metres | Hit Up Running Metres | Kick Return Metres | Position | Minutes Played | |
|---|---|---|---|---|---|---|---|---|---|---|---|---|---|---|---|---|---|---|---|---|
| Rd 1 | Broncos | 50 - 4 | - | - | - | - | - | - | - | 2 | 13 | 2 | 8 | 24 | 3 | 52 | 52 | - | 2nd Row | 70 |
| Rd 2 | Wests Tigers | 18 - 30 | - | - | - | - | - | - | - | - | 25 | - | 11 | 21 | 1 | 68 | 68 | - | 2nd Row | 70 |
| Rd 3 | Warriors | 42 - 4 | - | - | - | - | - | - | - | - | 6 | - | 9 | 35 | 2 | 24 | 24 | - | 2nd Row | 70 |
| Rd 4 | Titans | 6 - 34 | - | - | - | - | - | - | - | - | 11 | - | 6 | 28 | 1 | 32 | 32 | - | 2nd Row | 70 |
| Rd 5 | Raiders | 16 - 18 | - | - | - |
Recent games
- Round9v Knights2nd Row · 18 min · 10 run m · 6 tackles6 - 40
- Round8v Dragons2nd Row · 70 min · 34 run m · 24 tackles28 - 32
- Round7v Sharks2nd Row · 61 min · 36 run m · 12 tackles30 - 18
- Round6v Bulldogs2nd Row · 57 min · 35 run m · 25 tackles28 - 26
- Round5v Raiders2nd Row · 65 min · 33 run m · 32 tackles16 - 18
- Round4v Titans2nd Row · 70 min · 32 run m · 28 tackles6 - 34
- Round3v Warriors2nd Row · 70 min · 24 run m · 35 tackles42 - 4
- Round2v Wests Tigers2nd Row · 70 min · 68 run m · 21 tackles18 - 30
Stats from official league and public sports feeds. Updated hourly. Career and honours from Wikidata (CC0).